Research
Industry reports, statistics, data visualizations, and evidence-based insights on how we live—drawn from surveys, building science, and global adoption trends.
2
Research reports
4
Data visualizations
12,000+
Households surveyed
Key Findings
67%
Smart home adoption
Households with at least one connected device globally
42%
Energy savings
Average reduction with whole-home efficiency upgrades
2–5×
Indoor pollution
Higher pollutant levels indoors vs. outdoors in cities
78%
Solar interest
Homeowners considering solar within the next 3 years
31%
Heat pump growth
Year-over-year increase in residential heat pump installations
89%
Air quality concern
Readers who rank indoor air quality as a top home priority
Research Highlights
Adoption inflection point
Smart home device ownership crossed 67% globally in 2026—the first year majority adoption was recorded across all surveyed regions.
Indoor air gap
Households underestimate indoor pollutant levels by an average of 3× compared to lab measurements. Awareness campaigns move the needle faster than regulation.
Energy retrofit ROI
Whole-home efficiency upgrades deliver 42% average energy reduction, with heat pumps and envelope work showing the fastest payback under current incentives.
Solar intent surge
78% of homeowners plan solar within three years—driven by battery pairing, aesthetic BIPV options, and rising utility rates.
Data Visualizations
Share of households with at least one connected device
Percent of adopters who own each category
Why households prioritize air quality upgrades
- Cooking pollution34%
- Allergens / pets28%
- VOCs / materials18%
- Outdoor infiltration12%
- Humidity / mold8%
Indexed growth (2020 = 100)
Research Reports
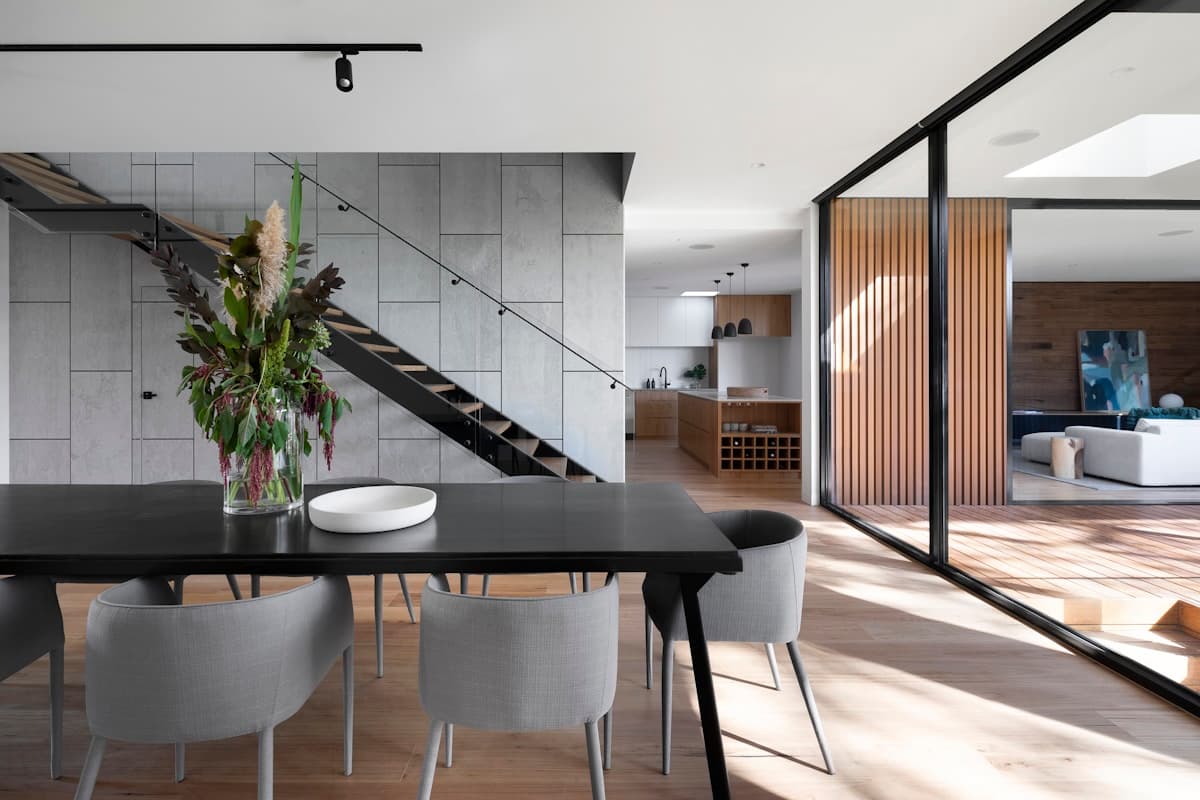
The Indoor Air Quality Crisis Nobody Talks About
New research reveals alarming gaps between outdoor air standards and the invisible pollutants inside our homes.
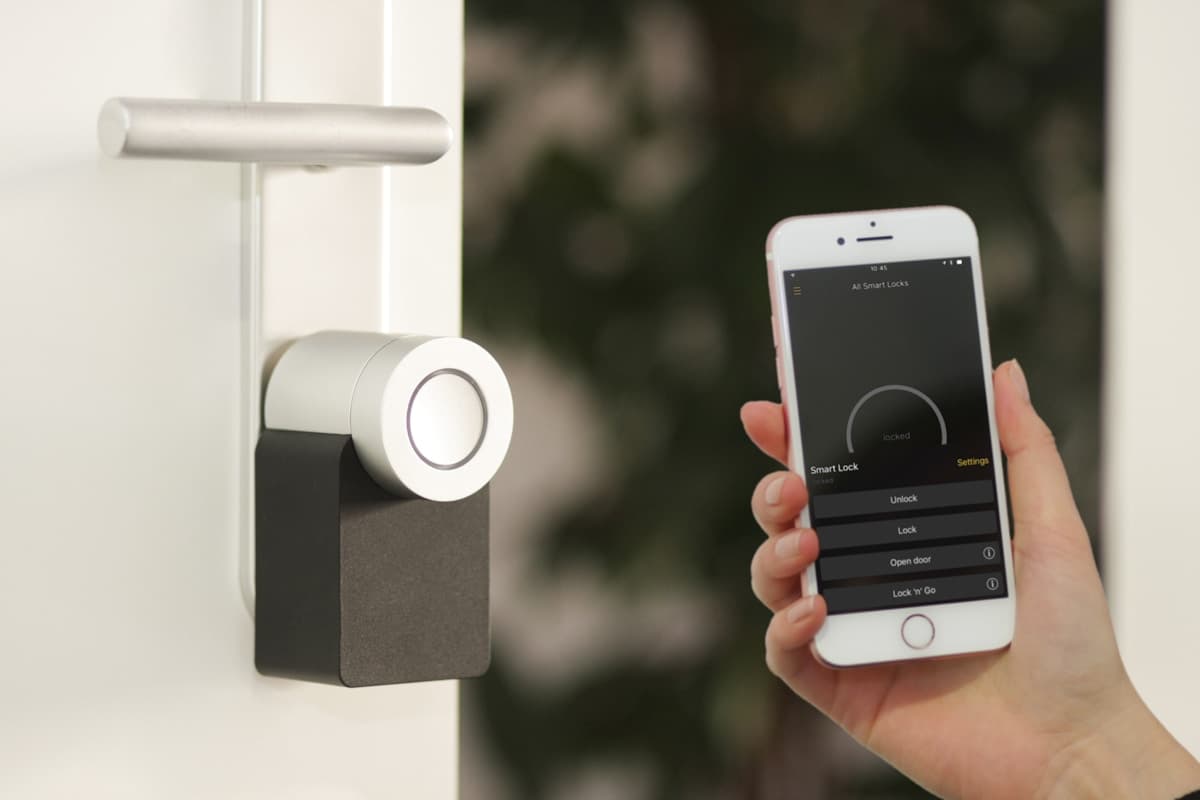
Global Smart Home Adoption Report 2026
Smart home adoption has reached an inflection point. Our research reveals who is adopting, what they are buying, and what comes next.